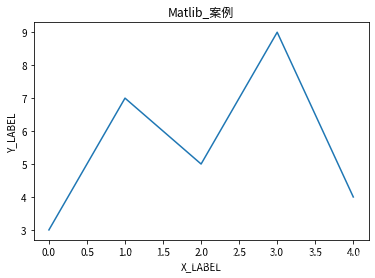
from matplotlib import pyplot as plt
plt.rcParams[\'font.family\'] = \'Noto Sans CJK JP\'
plt.rcParams[\'axes.unicode_minus\'] = False
plt.figure()
plt.subplot(1,1,1)
x=[0,1,2,3,4]
y=[3,7,5,9,4]
plt.ylabel(\'Y_LABEL\')
plt.xlabel(\'X_LABEL\')
plt.title(\'Matlib_案例\')
plt.plot(x,y)
plt.show()
[/code]
```code
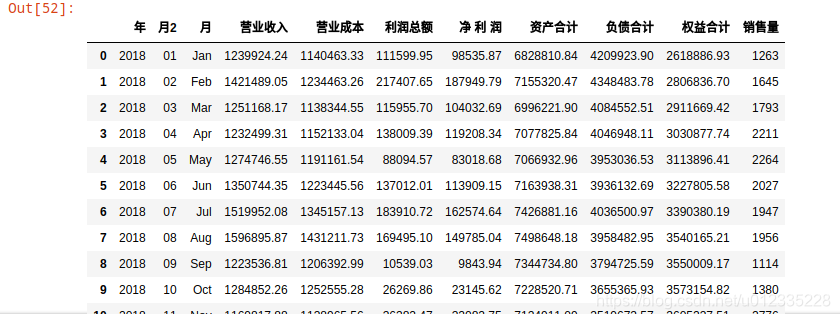
import pandas as pd
df1 = pd.read_excel(r\'./fin_databak.xlsx\',sheet_name=0,converters={\'年\':str,\'公司\':str})
monthdict={\'Jan\':\'01\',\'Feb\':\'02\',\'Mar\':\'03\',\'Apr\':\'04\',\'May\':\'05\',\'Jun\':\'06\',\'Jul\':\'07\',\'Aug\':\'08\',\'Sep\':\'09\',\'Oct\':\'10\',\'Nov\':\'11\',\'Dec\':\'12\'}
df1 = df1.drop(\'月2\',axis=1,errors=\'ignore\')
df1.insert(2,\'月2\',value=df1[\'月\'].map(lambda x:monthdict[x]))
df2 = df1.sort_values(by=[\'公司\',\'年\',\'月2\'],ascending=True).reset_index(drop=True)
df3 = pd.read_excel(r\'./fin_databak.xlsx\',sheet_name=1,converters={\'年\':str,\'公司\':str})
df4 = pd.merge(df2,df3,how=\'left\')
df6 = df4.groupby([\'年\',\'月2\',\'月\'],as_index=False).sum()
df6.head(12)
[/code]
```code
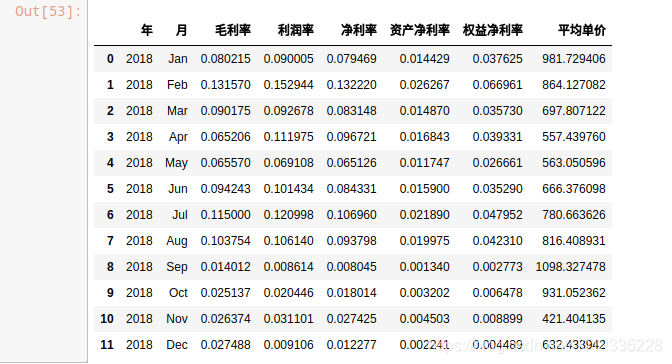
df6[\'毛利率\'] = (df6[\'营业收入\']-df6[\'营业成本\'])/df6[\'营业收入\']
df6[\'利润率\'] = df6[\'利润总额\']/df6[\'营业收入\']
df6[\'净利率\'] = df6[\'净 利 润\']/df6[\'营业收入\']
df6[\'资产净利率\'] = df6[\'净 利 润\']/df6[\'资产合计\']
df6[\'权益净利率\'] = df6[\'净 利 润\']/df6[\'权益合计\']
df6[\'资产负载率\'] = df6[\'负债合计\']/df6[\'资产合计\']
df6[\'平均单价\'] = df6[\'营业收入\']/df6[\'销售量\']
df7 = df6.loc[(df6[\'年\']==\'2018\'),[\'年\',\'月\',\'毛利率\',\'利润率\',\'净利率\',\'资产净利率\',\'权益净利率\',\'平均单价\']]
df7
[/code]
```code
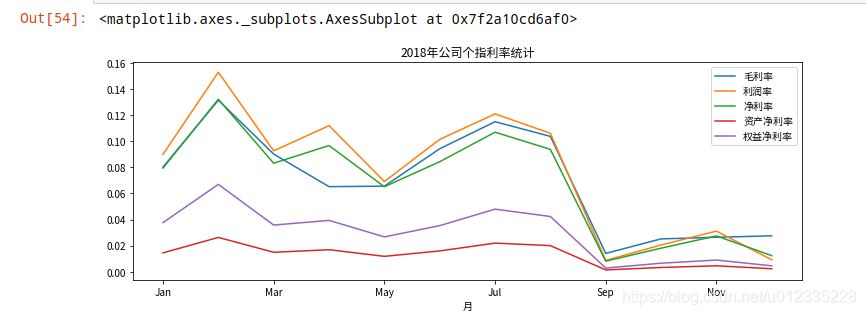
df7.plot(x=\'月\',y=[\'毛利率\',\'利润率\',\'净利率\',\'资产净利率\',\'权益净利率\'],title=\'2018年公司个指利率统计\',figsize=(12,4))
[/code]
```code
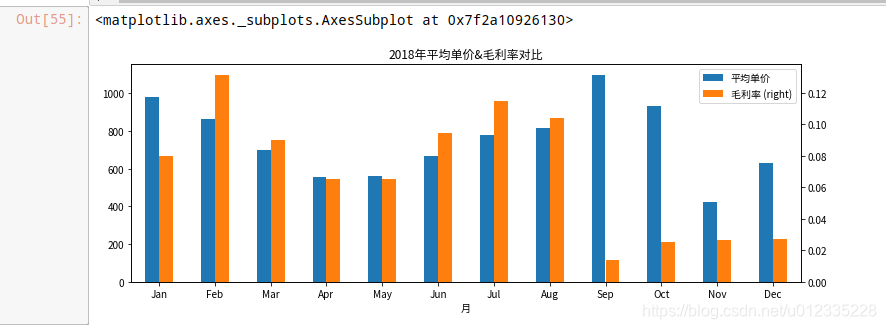
df7.plot(\'月\',[\'平均单价\',\'毛利率\'],secondary_y=[\'毛利率\'],kind=\'bar\',title=\'2018年平均单价&毛利率对比\',figsize=(12,4),rot=0)
[/code]
```code
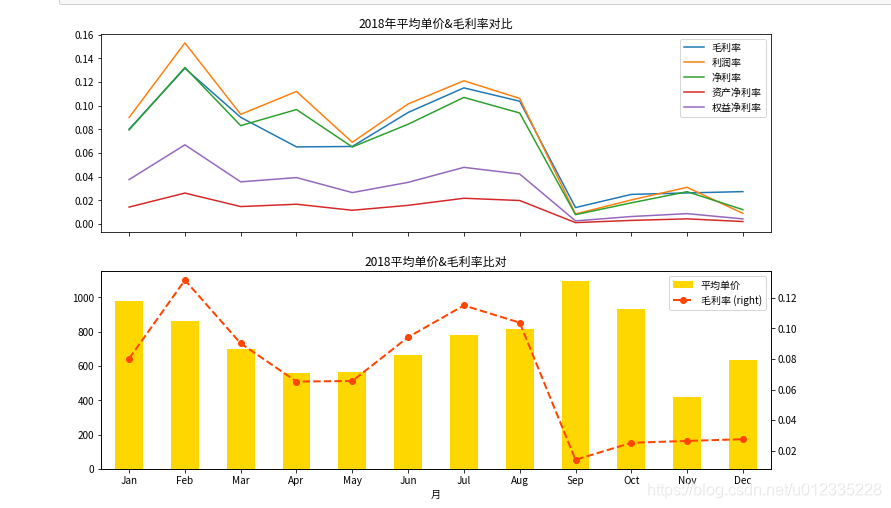
figure,axes = plt.subplots(2,1,figsize=(12,8),sharex=True)
ax0 = df7.plot(\'月\',[\'毛利率\',\'利润率\',\'净利率\',\'资产净利率\',\'权益净利率\'],title=\'2018年平均单价&毛利率对比\',ax=axes[0])
ax1 = df7.plot(\'月\',\'平均单价\',kind=\'bar\',title=\'2018平均单价&毛利率比对\',color=\'gold\',ax=axes[1])
ax2 = df7.plot(\'月\',\'毛利率\',secondary_y=True,color=\'orangered\',ax=axes[1],style=\'--\',marker=\'o\',linewidth=2)
[/code]
```code
from pyecharts.charts import Bar
from pyecharts import options as opts
[/code]
```code
bar = (
Bar()
.add_xaxis([\'A公司\',\'B公司\',\'C公司\',\'D公司\',\'E公司\',\'F公司\'])
.add_yaxis(\'库存量\',[100,200,360,100,750,900])
)
bar.render_notebook
[/code]
```code
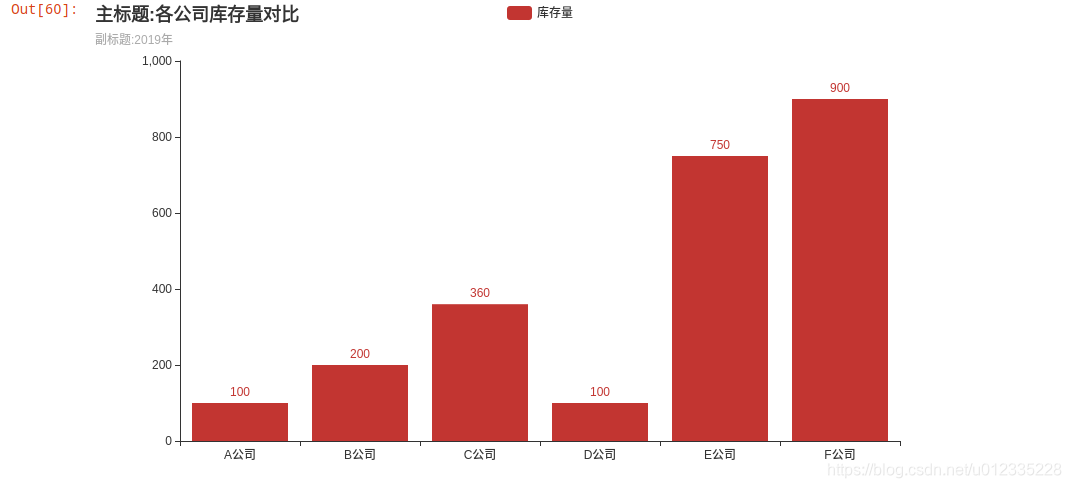
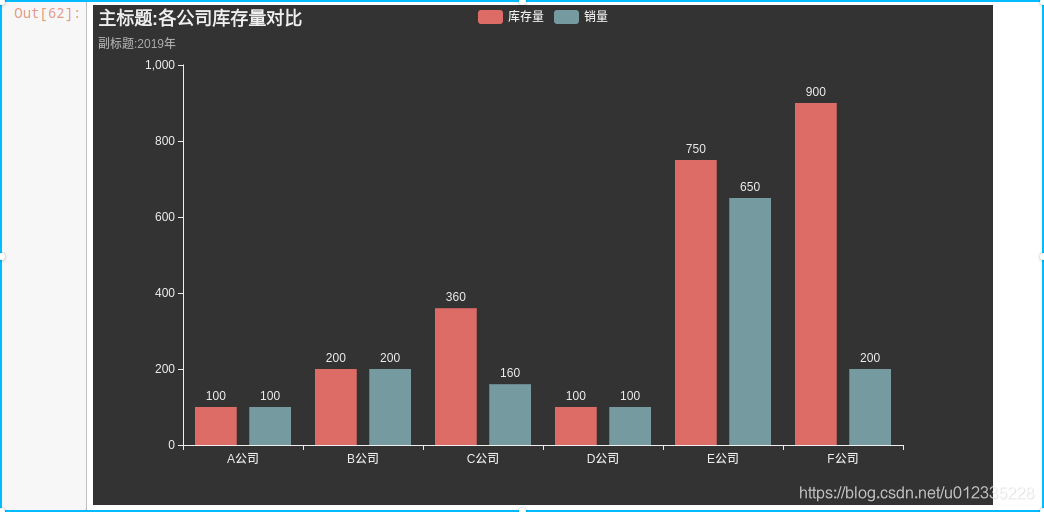
from pyecharts.globals import ThemeType
bar = (
Bar(init_opts=opts.InitOpts(theme=ThemeType.DARK))
.add_xaxis([\'A公司\',\'B公司\',\'C公司\',\'D公司\',\'E公司\',\'F公司\'])
.add_yaxis(\'库存量\',[100,200,360,100,750,900])
.add_yaxis(\'销量\',[100,200,160,100,650,200])
.set_global_opts(title_opts=opts.TitleOpts(title=\'主标题:各公司库存量对比\',subtitle=\'副标题:2019年\'))
)
bar.render_notebook()
[/code]
```code
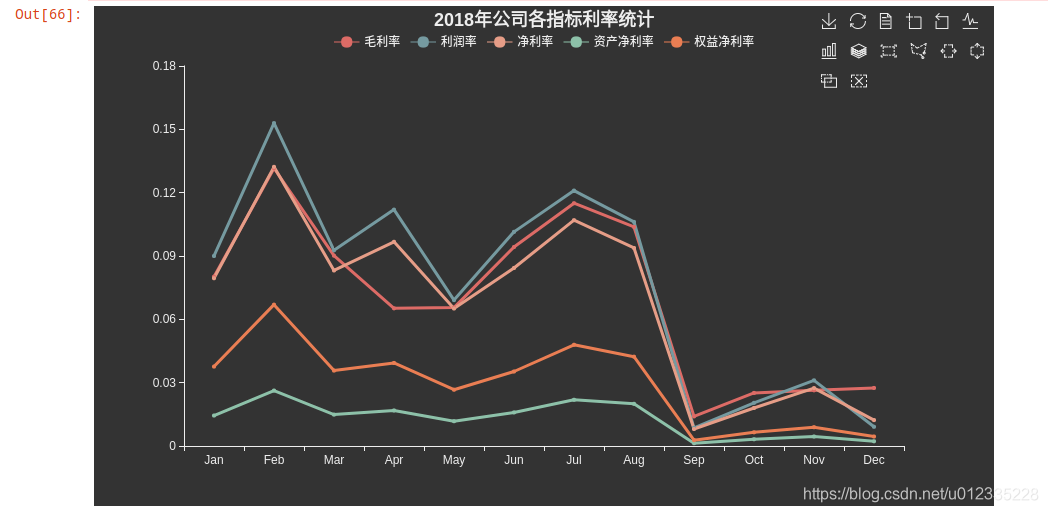
from pyecharts.charts import Line
y1 = df7[\'毛利率\'].tolist()
y2 = df7[\'利润率\'].tolist()
y3 = df7[\'净利率\'].tolist()
y4 = df7[\'资产净利率\'].tolist()
y5 = df7[\'权益净利率\'].tolist()
x = df7[\'月\'].tolist()
line = (
Line(init_opts=opts.InitOpts(theme=ThemeType.DARK))
.add_xaxis(x)
.add_yaxis(\'毛利率\',y1,linestyle_opts=opts.LineStyleOpts(width=3))
.add_yaxis(\'利润率\',y2,linestyle_opts=opts.LineStyleOpts(width=3))
.add_yaxis(\'净利率\',y3,linestyle_opts=opts.LineStyleOpts(width=3))
.add_yaxis(\'资产净利率\',y4,linestyle_opts=opts.LineStyleOpts(width=3))
.add_yaxis(\'权益净利率\',y5,linestyle_opts=opts.LineStyleOpts(width=3))
.set_global_opts(title_opts=opts.TitleOpts(title=\'2018年公司各指标利率统计\',
pos_left=\'center\'),legend_opts=opts.LegendOpts(pos_top=\'5%\'),
toolbox_opts=opts.ToolboxOpts(pos_top=\'%5\'))
.set_series_opts(label_opts=opts.LabelOpts(is_show=False))
)
line.render_notebook()
[/code]