LaTeX下的表格处理
LaTeX下的表格处理
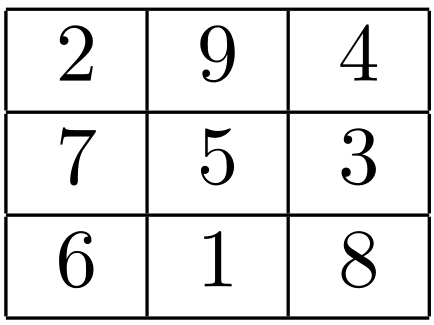
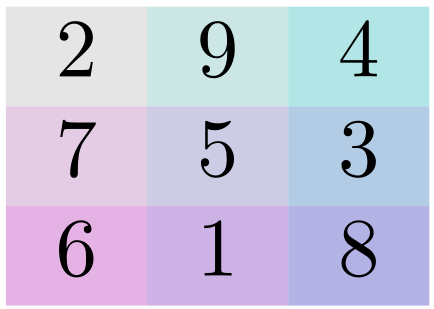
在LaTeX里面,画一个表格大致上是如此:
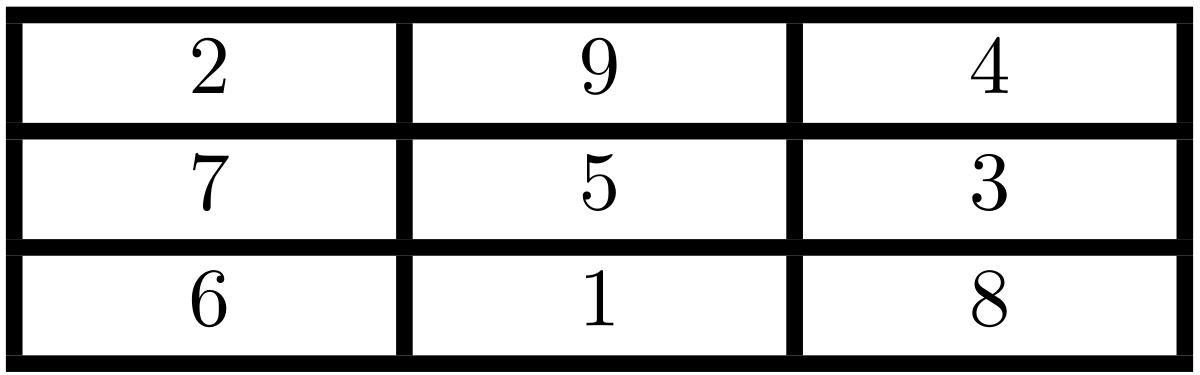
\begin{tabular}{|c|c|c|} \hline 2&9&4\\ \hline 7&5&3\\ \hline 6&1&8\\ \hline \end{tabular} 画出来实际上是这样:
 这个tabular环境是LaTeX下面定义好了的,除了tabular环境外还有tabbing和array环境。还是讲tabular环境好了,LaTeX还定义了如下的一条命令:
%\multicolumn{n}{format}{item} \begin{tabular}{|c|c|c|} \hline \multicolumn{3}{|c|}{?}\\ \hline 7&5&3\\ \hline 6&1&8\\ \hline \end{tabular} 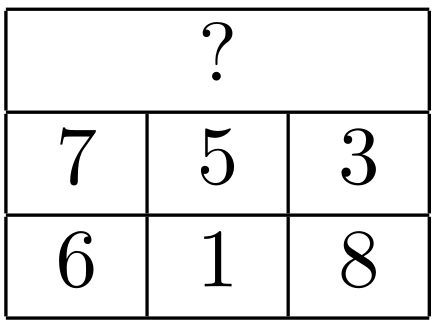 我们给出的这个例子里面的|c|这样的,那个地方叫做导言区,来约定表格的每列属性的:
% l c r: 居左,居中,居右 % | ||: 单线,双线 % @{exp}: 插入到列中的文本 % *{n}{pre}: 重复pre内容n次 % p{len}: 将列放入一个parbox中 所以第一个例子我们可以这样:
\begin{tabular}{*{3}{|c}|} 不过,真是要用这些个,别给自己绕晕了。在处理表格的时候,可以调节一下参数,比如这样:
\tabcolsep20pt \arrayrulewidth2pt 结果是这样的:
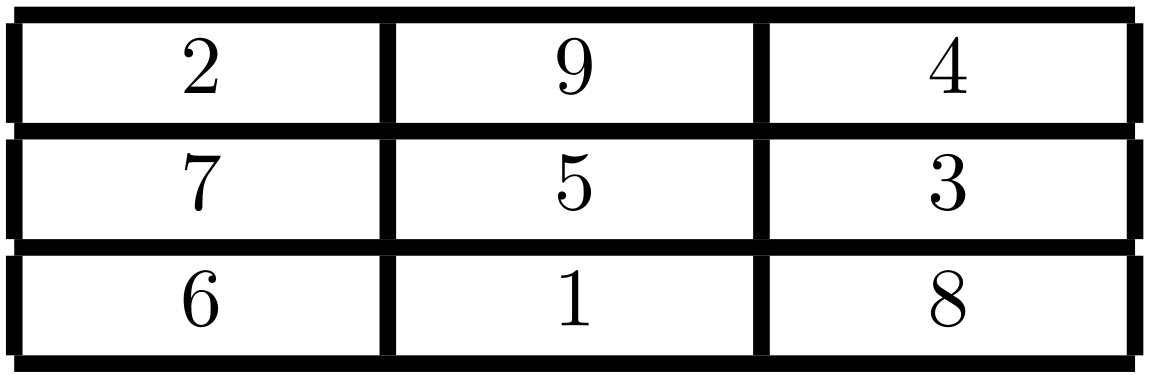
这里面的线存在着一定的空缺,这是因为水平和垂直方向上面的线都是和行或列直接关联的,如果线条宽度过大,只能保证线条在一部分上能够接上,调太粗了就接不上了。TeX中默认的线条宽度是0.4pt,过于细了,如有可能,这有必要改一下的。
实际上,array包重新实现了tabular环境,加了不少新选项进去,如:
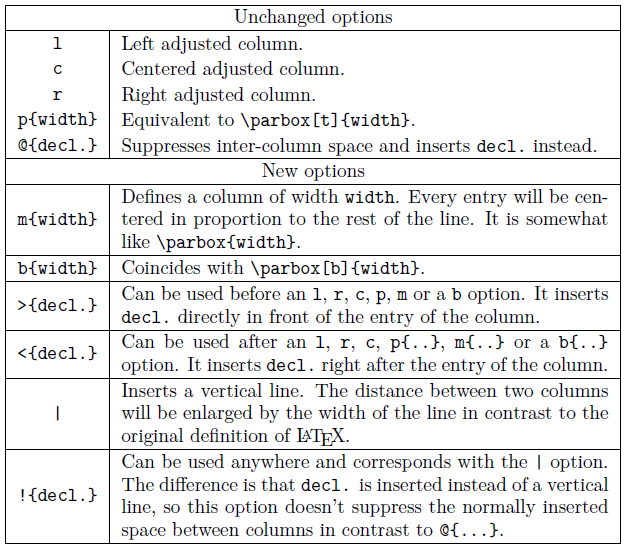 array给出了一个新的选项,可以定义列类型:
\newcolumntype{F}{>{$}c<{$}} 然后我们可以这样:
%\usepackage{array} \newcolumntype{F}{>{$}c<{$}} \begin{tabular}{FFF} \alpha & \beta & \gamma \\ \delta & \epsilon & \upsilon \\ \sigma & \tau & \phi \\ \end{tabular} 另一个改进,就是设定线宽度那个,代码不变,加了array包之后就是这样(貌似很神奇的样子):
 下面该说说三线表booktabs了,比如说:
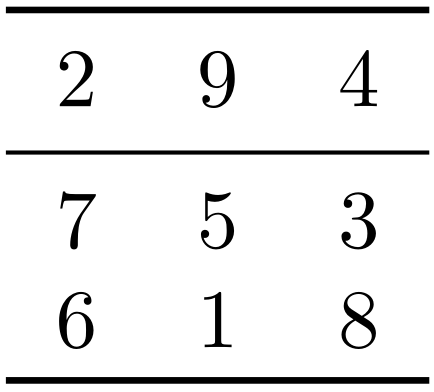
% \usepackage{booktabs} \begin{tabular}{ccc} \toprule 2&9&4\\ \midrule 7&5&3\\ 6&1&8\\ \bottomrule \end{tabular} 输出的效果是这样:
 其实,这三条线的定义里面,\toprule和\bottomrule的定义非常类似,你看看booktabs.sty中的定义就知道了:
\def\toprule{\noalign{\ifnum0=`}\fi \@aboverulesep=\abovetopsep \global\@belowrulesep=\belowrulesep \global\@thisruleclass=\@ne \@ifnextchar[{\@BTrule}{\@BTrule[\heavyrulewidth]}} \def\midrule{\noalign{\ifnum0=`}\fi \@aboverulesep=\aboverulesep \global\@belowrulesep=\belowrulesep \global\@thisruleclass=\@ne \@ifnextchar[{\@BTrule}{\@BTrule[\lightrulewidth]}} \def\bottomrule{\noalign{\ifnum0=`}\fi \@aboverulesep=\aboverulesep \global\@belowrulesep=\belowbottomsep \global\@thisruleclass=\@ne \@ifnextchar[{\@BTrule}{\@BTrule[\heavyrulewidth]}} 差别在哪里呢?来继续看:
\belowrulesep=.65ex \belowbottomsep=0pt booktabs这个包就是提供了不同宽度的线条罢了。
接下来是比较常用的colortbl包了,用来填色:
% \usepackage{colortbl} \begin{tabular}{ccc} \rowcolor[gray]{.9} 2&9&4\\ \rowcolor[gray]{.8} 7&5&3\\ \rowcolor[gray]{.7} 6&1&8\\ \end{tabular} 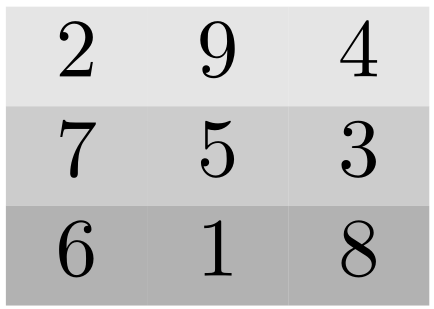 当然也可以这样:
% \usepackage{colortbl} \begin{tabular}% {>{\columncolor[gray]{.9}}c% >{\columncolor[gray]{.8}}c% >{\columncolor[gray]{.7}}c} 2&9&4\\ 7&5&3\\ 6&1&8\\ \end{tabular} 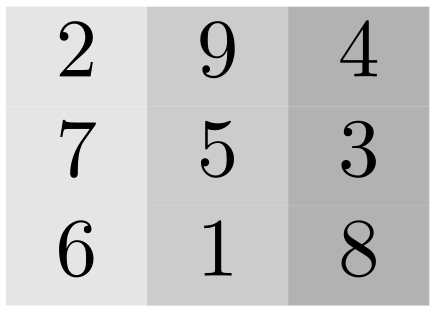 还可以是这样:
\begin{tabular}{ccc}
\cellcolor[rgb]{.9,.9,.9}2&
\cellcolor[rgb]{.8,.9,.9}9&
\cellcolor[rgb]{.7,.9,.9}4\\
\cellcolor[rgb]{.9,.8,.9}7&
\cellcolor[rgb]{.8,.8,.9}5&
\cellcolor[rgb]{.7,.8,.9}3\\
\cellcolor[rgb]{.9,.7,.9}6&
\cellcolor[rgb]{.8,.7,.9}1&
\cellcolor[rgb]{.7,.7,.9}8\\
\end{tabular}
 需要注意的是颜色搭配,搭配好了,事半功倍,搭配不好,那就乡村非主流了。
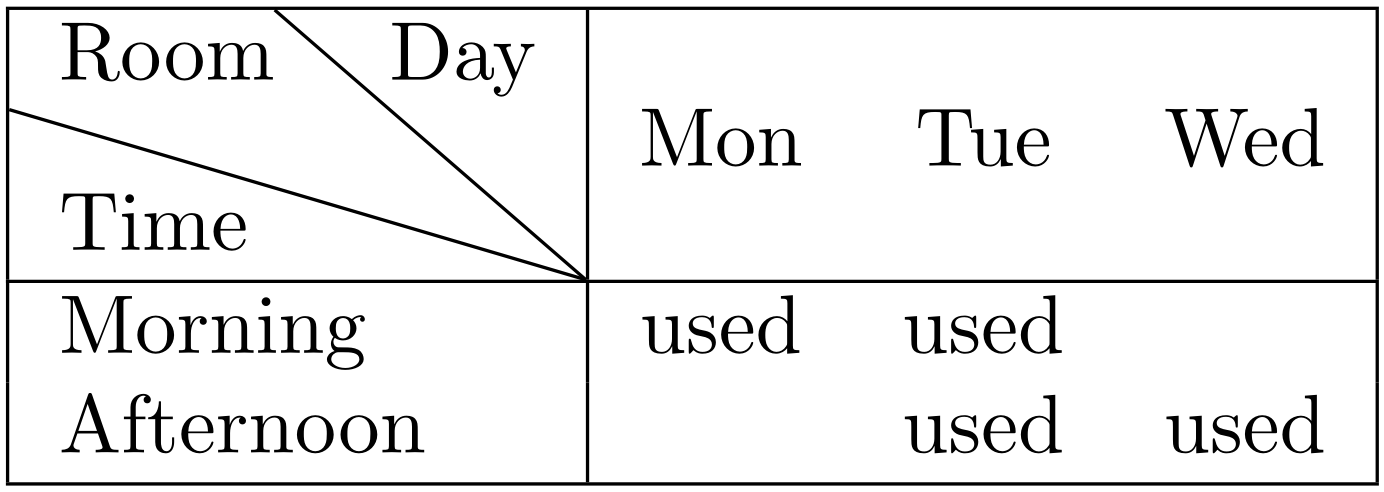
还有个强烈推荐的,画斜线表头的diagbox包,作者嘛,刘海洋,文档有中文版,你们肯定都能看得懂(也没理由看不懂啊),那我就搬个例子好了:
% \usepackage{diagbox} \begin{tabular}{|l|ccc|} \hline \diagbox{Time}{Room}{Day} & Mon & Tue & Wed \\ \hline Morning & used & used & \\ Afternoon & & used & used \\ \hline \end{tabular} 是这样:
 和文中开头的\multicolumn相对应的\multirow命令由multirow包提供,我们可以试着这样套嵌一下:
% \usepackage{multirow} \begin{tabular}{|ccc|} \hline 2&9&4\\ 7&\multicolumn{2}{c|}{\multirow{2}*{{?}}}\\ 6&&\\ \hline \end{tabular} 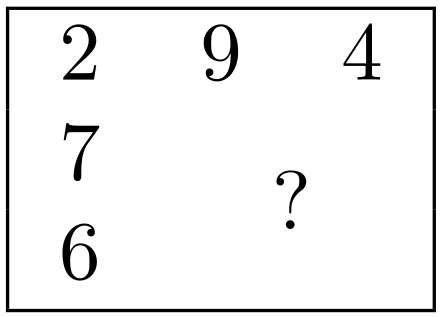 我个人觉得最好的一个包其实是tabu包。比如LaTeX/Tables这里面的这个例子,如果用tabu包的话,可以是这样的设定:
% \usepackage{tabu} \begin{tabu} to \hsize {|X|X|X|X[3,l]|} \hline Day & Min Temp & Max Temp & Summary \\ \hline Monday & 11C & 22C & A clear day with lots of sunshine. However, the strong breeze will bring down the temperatures. \\ \hline Tuesday & 9C & 19C & Cloudy with rain, across many northern regions. Clear spells across most of Scotland and Northern Ireland, but rain reaching the far northwest. \\ \hline Wednesday & 10C & 21C & Rain will still linger for the morning. Conditions will improve by early afternoon and continue throughout the evening. \\ \hline \end{tabu} 效果是这样(当然效果还可以再调整了):
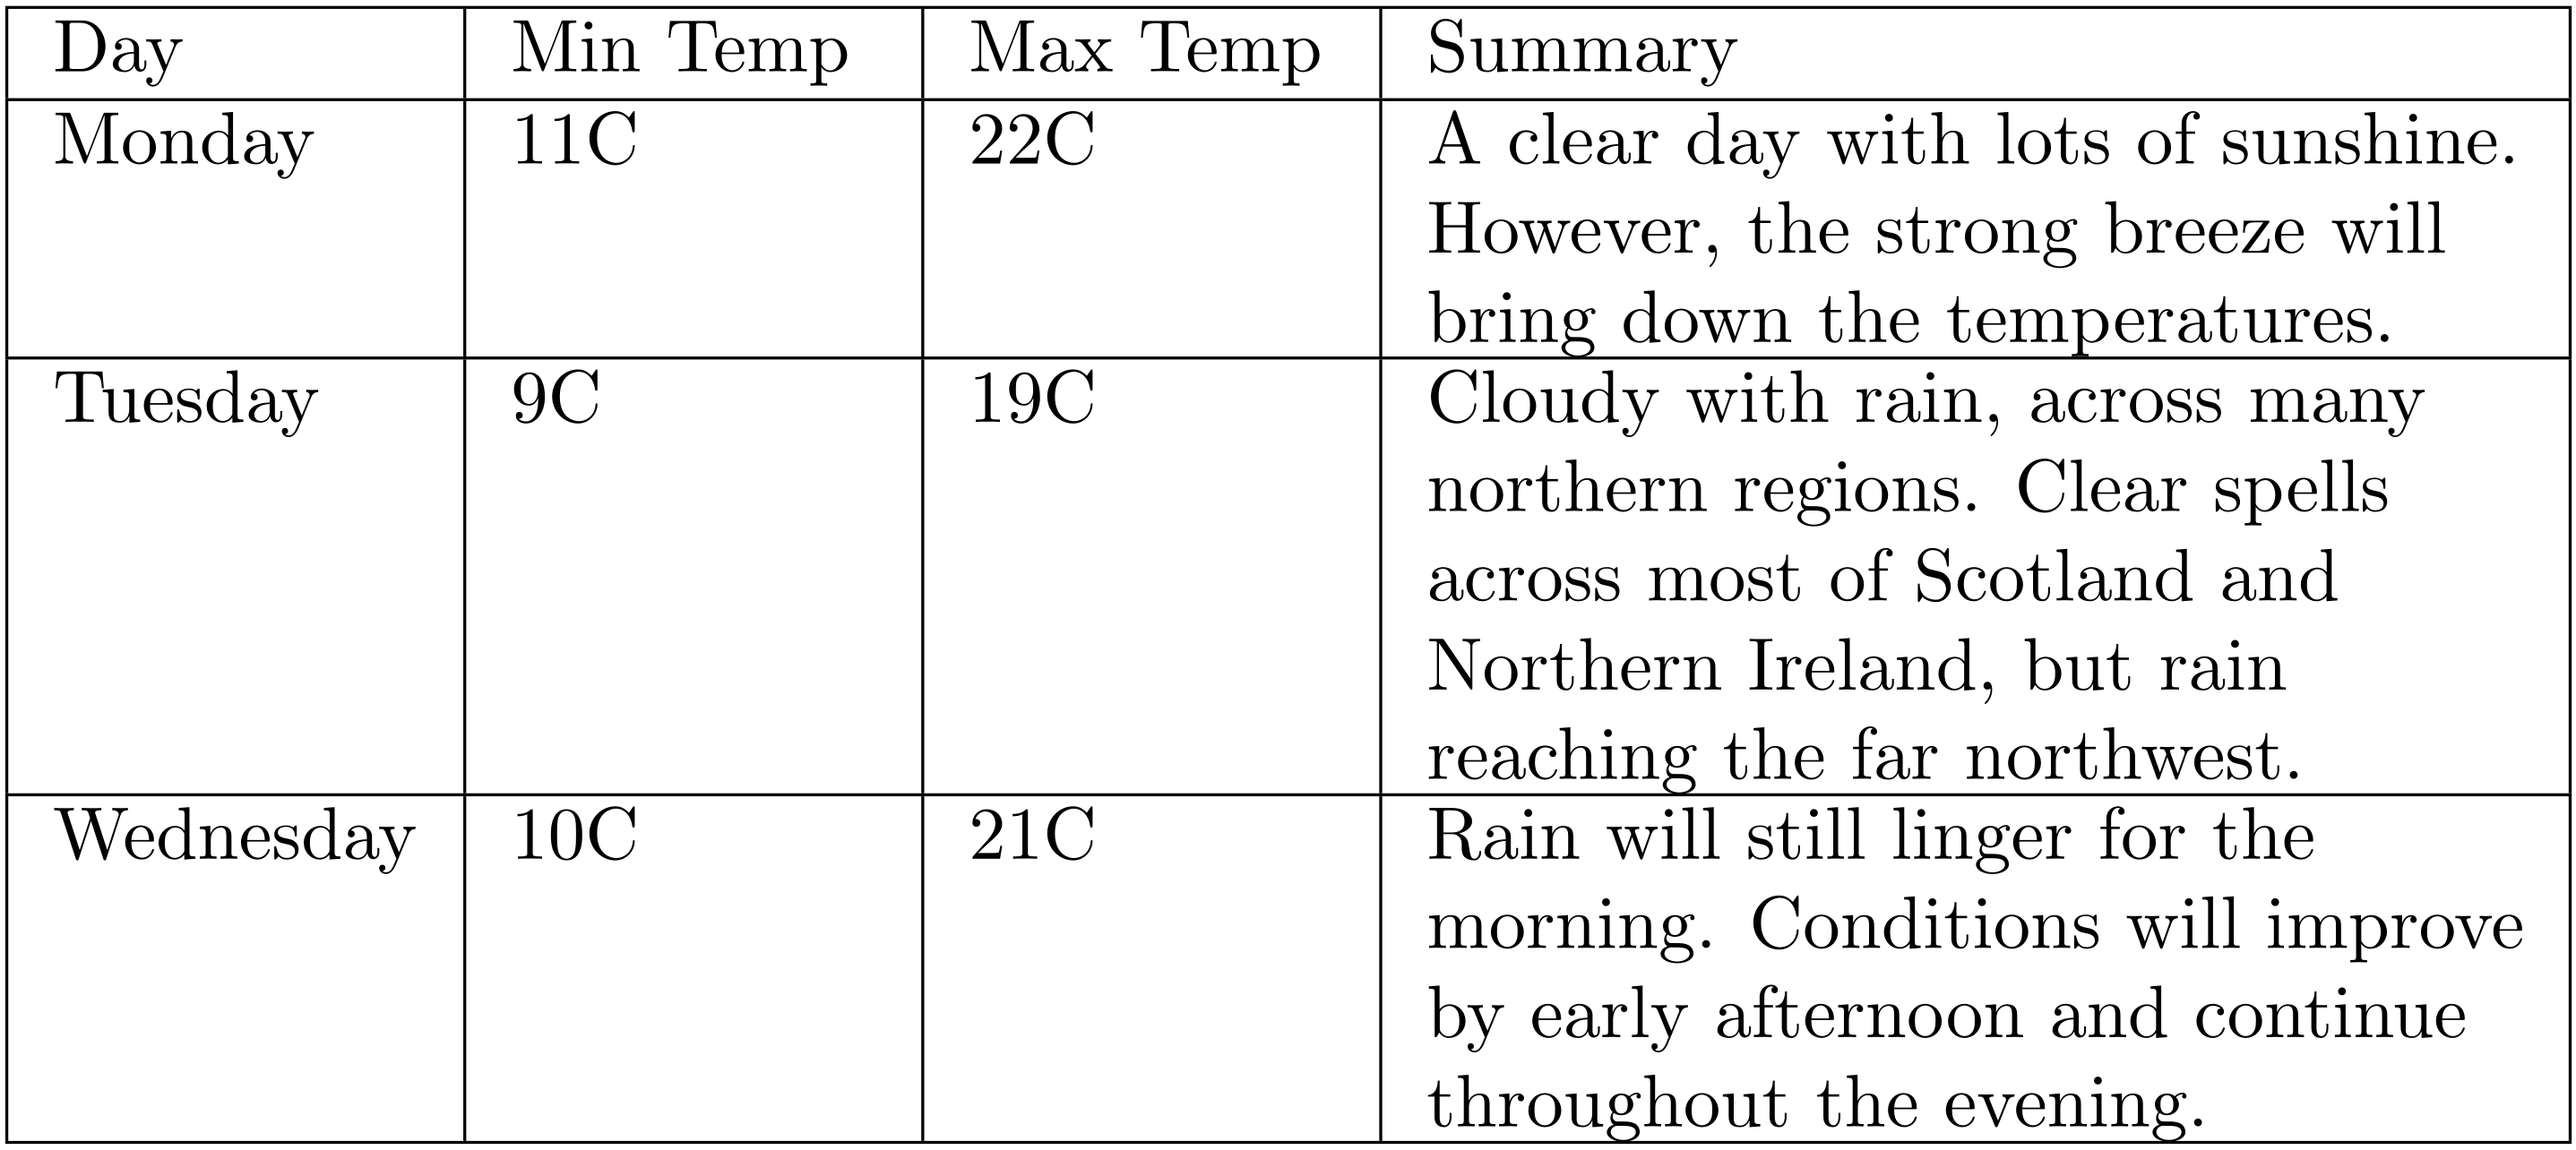 这个X呢会让tabu自动算出宽度来,所以不需要再怎么仔细地设定宽度了,当然想要强制指定一个参数也不是不可以。
行了,今天就介绍这么多了,还有什么longtable之类的,懒得介绍了,表格的用法就这样了,差不多。有个地方需要注意:TeX中的表格有个列数限制,最大256列。
此文链接:http://makaidong.com/lijingcong/282021_3041243.html
转载请注明出处:LaTeX下的表格处理(转)